
![]() JMeter is a desktop application that can be used to perform functional testing and load testing.
JMeter is a desktop application that can be used to perform functional testing and load testing.
While the JMeter application itself is designed as pure Java application, it can be used to perform load testing of any kind of web application, including those that are written in PHP, .NET, etc.
The original intent of the application was to test the performance of Apache Tomcat, which is basically a web server.
Over the years, Jmeter slowly evolved with improvements in user interface, and additional features to make it a viable performance testing and load testing tool for enterprise web applications.
What is JMeter?
JMeter is part of Apache Open Source project.
It was originally written to test the performance of web servers and now it have evolved as a automated testing tool with test data as well as functional testing tool for a web application, file server, web server and even database. We’ll explore the important features of JMeter in this tutorial.
It is configurable to simulate N number of users and threads targeting a particular web server or application. It generates a simulated load for your web application to measure its performance. Moreover, you can induce several iteration with loops to get an average result, implement the assertion, and view graphical and statistical representation of the test results.
As you see from the following screenshot, you can see the various configuration that can be done while creating a test plan. You can create multiple threads, several test fragments, configure the individual elements, set timers for various testing, set-up pre and post processor to do some application specific routines, set assertions and listeners for your test plan.
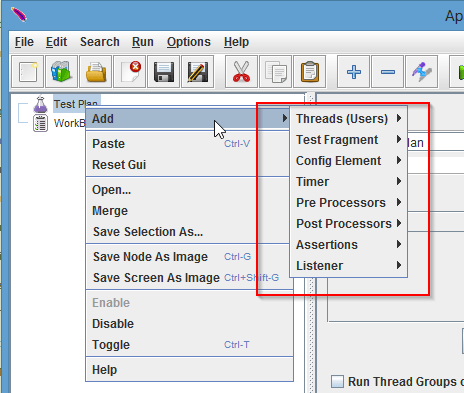
Test plan in this context is the point where you start setting the testing configuration that are specific to your application.
Right clicking to the “Test Plan” item reveals the menu. In menu, on hover to the “Add” items you can see the basic test features which you can create for a test plan.
The test features are created once, and then later are executed by the tester. The JMeter, as per the provided configurations creates a simulated load/stress, test data, graphical stats as well as asserts the criteria.
Lets see an example on how we can start by using few of the “Add” sub menu items to create a test plan and execute it to analyze the performance of a web application.
As you can imagine, the performance of a web application or website depends on various factors like your internet connection bandwidth, hosting server, web server used and even the way the site is developed in terms of scripting practices followed.
Create a Thread Group under Test Plan
Right click the “Add” item and navigate to Threads -> Threads group.
A thread can be visualized as equivalent to a user accessing a web server in a real time environment.
Click on the “Thread group” item to create it under your test plan.
A thread group will be created nested under the test plan in the left panel. Click on the thread group to view the various options and parameters you can set as per your load testing and performance testing requirement as shown below.
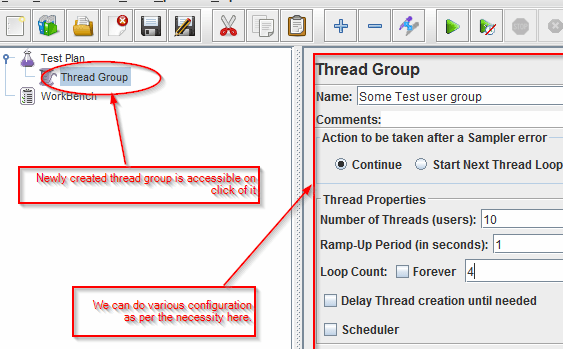
You can specify a name to the thread group, and create N number of thread groups to simulate different scenarios.
For example, You may want to know the performance of your web application with 100 concurrent users, 500 concurrent users, etc.
So here you can create different thread groups with different ramp up period and loop count. Just specify the number of user threads you want to generate in “Number of Threads” text box. In the screen shot above it is set to 10.
Ramp up period as the name suggest is nothing but the total amount of time taken by all of the threads together in a thread group to complete the initiation to hit the target.
It should be set within the web servers maximum capability or you can play around with it to find the ideal time for different scenarios.
As you can see in the screen shot above, we can also select the “action to be taken after sample error”. This indicates what needs to be done when a thread launched is not able to successfully complete the request to response cycle due to any reason because of which a sample to be taken gives improper results.
We can continue to take the sample for multiple times by giving the loop count in numbers or by setting it to take sample n no of times by selecting the “forever” option.
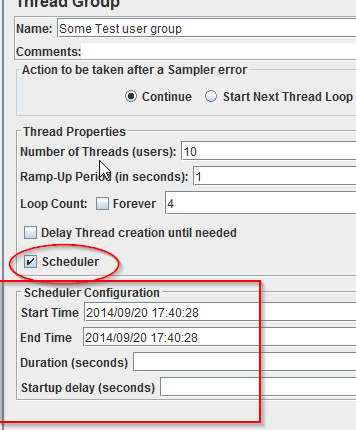
You can also schedule the created thread to run automatically at a given time by selecting the scheduler option as shown in the screen shot below.
Add Request Sampler under Thread Group
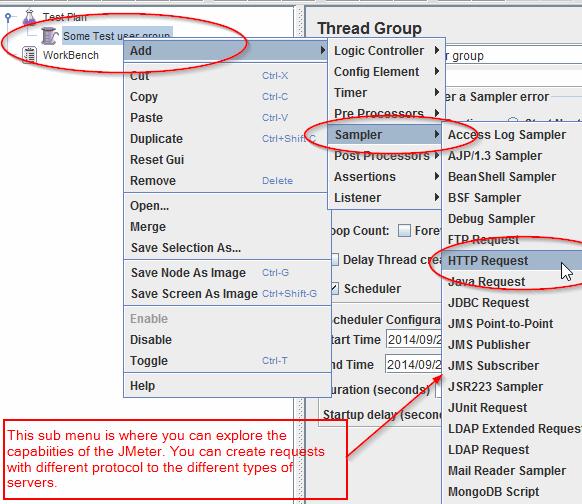
Right click the created thread group in the left panel and navigate to Add ? Sampler ? HTTP Request by keeping on hovering the items. Now click on “HTTP Request” to add a sampler of this type/kind.
Similarly you can go through the lots of option there and explore the capability of JMeter to create different type of request/connection threads for various protocol to target different type of servers as shown in the following screenshot.
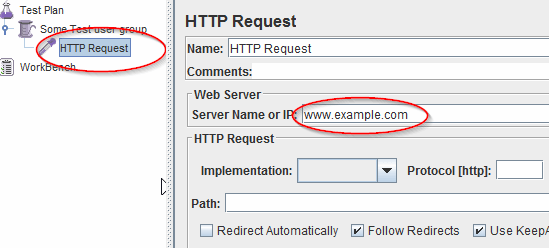
In the following example, We are creating a http request sampler because our intent is to test a website or say an underlying web server performance.
Now you can view the newly added “http request sampler” under the thread group. Click on it to view the configuration panel. Here we are just setting our target domain to example.com for demonstration purpose as shown below.
Add Listener under Thread Group
A listener is added to track the respective thread group and view the performance stats in graphical view, or record it to a log file.
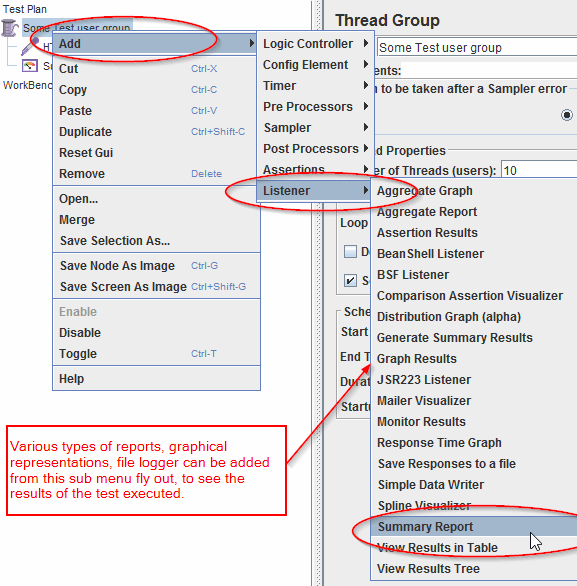
If you want to view the summary report, do the following: Right click the thread group in the left panel and navigate to Add ? Listener ? Summary Report. Now click on the “Summary Report” to add it under the thread group.
You can now see a “Summary Report” added under the thread group in left panel and on click of it you will be able to see a blank report in main content.
Execute the Thread Group for Load Testing
Select the appropriate thread group, and press Ctrl + R or click the green run button in the shortcuts panel above as shown below. You can now see the numbers counting in the top right corner displaying the current number of threads launched, and the thread sample that are not able to complete the sampling cycle because of errors.
In the summary table in the main content area you will be able to see the summary report.
In the above summary report, unit used for showing the Average, Min and Maximum time taken is shown in milliseconds.
When you execute the test again without clearing this report, it will keep on adding the number of samples to the total summary. Sometimes, you may want to start a brand new test run ignoring the previous results. For this, you should ignore the previous performance data by clicking to the clear button in the shortcut panel.


 My name is Ramesh Natarajan. I will be posting instruction guides, how-to, troubleshooting tips and tricks on Linux, database, hardware, security and web. My focus is to write articles that will either teach you or help you resolve a problem. Read more about
Comments on this entry are closed.
It looks like nice app to work with, and usefull as well
in my opinion Tsung is much better than Jmeter
Hi,
Thanks a lot for very nice article
Try apache bench or siege if you want something more straightforward.
Great article and very useful indeed.
Thanks!
Chuck
it takes care of lot of protocols,
Thanks for sharing this Ramesh
hi i am using jmeter tool ,but i have so doughts
how can i define best report or not ??
how can i modify errors??
please help me???
thank you.