
 htop is just like top, but on steroids.
Once you are used to htop, you’ll never go back to top again.
htop is a ncurses-based process viewer.
You can interact with the htop using mouse. You can scroll vertically to view the full process list, and scroll horizontally to view the full command line of the process.
This article explains 15 essential htop command examples.
Install Htop
top command is available on all Linux system by default.
To use htop, you need to install it first. Go to htop download page, and download the binaries that corresponds to your Linux distribution and install it.
If you prefer to install htop from souce, download the source code, and do the following. This will install htop under /usr/local/bin.
tar xvfz htop-0.9.tar.gz
cd htop-0.9
./configure
make
make install
1. htop Output
htop output consists of three sections 1) header 2) body and 3) footer.
Header displays the following three bars, and few vital system information. You can change any of these from the htop setup menu.
- CPU Usage: Displays the %used in text at the end of the bar. The bar itself will show different colors. Low-priority in blue, normal in green, kernel in red.
- Memory Usage
- Swap Usage
Body displays the list of processes sorted by %CPU usage. Use arrow keys, page up, page down key to scoll the processes.
Footer displays htop menu commands.

2. Display CPU Averages in Header
htop by default displays a separate bar for every CPU (or core) on your system. On a multi core system, the list of individual CPU bar might be a distraction. Instead of multiple bars, you might want to display only one bar for CPU average usage.
Press F2 (or S) for setup menu -> Select “Meters” under setup -> Use right arrow to go to “Available Meters” column -> Use down arrow to select “CPU average” -> Press “F5”, which will add “CPU average” to the list under the “Left columns”.
Now, use left arrow to go to “Left columns” -> select “All CPUs” -> Press F9 to remove it from the “Left columns” -> Use down arrow, select “CPU” -> Press “F7” to move it to the top -> Press to come out of the setup menu.
This will show only the CPU average in the bar as shown below, instead of showing all the individual cores.

3. Display Processes Sorted by any htop Output Column – Press F6 or >
By default htop command displays the processes sorted by CPU usage. Press F6 (or >), which will display the column names, select any one of the column, and press Enter.
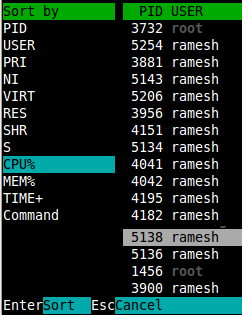
Note: Instead sorting columns by going to sort menu, you can also press the sortcut key “P” to sort by CPU%, “M” to sort by MEM%, or “T” to sort by TIME%.
4. Kill a Process Without Exiting From htop – Press F9 or k
To kill a process, Select the process that needs to be killed from the list, and press F9 (or k), which will display the “Send signal” menu that lists all the available signals that you can send to the command.
If you want to do “kill -9” on the selected process, select the “SIGKILL” from this menu, and press enter.

5. Renice a Unix Process Without Exiting From hTop – Press F7 or F8
Select the process that needs to be reniced from the list, and press F7 which will reduce the nice value of the process, press F8 which will increase the nice value of the process by one. If you press F8 three times, it sets the nice value of the process to 3.
6. Display Only Processes of a Single User – Press u
Press u, which will display “Show processes of” menu and list all the users who has some processes running. Select a user from this list, and press Enter, which will display only the processes that belongs to that particular user.

Note: You can also do “htop -u ramesh” from the command line, which will start htop and display only process that belong to the user ramesh.
7. Display Processes in Tree View – Press F5 or t
Tree view is expremely helpful to identify dependencies of a process. Press F5 (or t), which will display all the related processes in a tree view as shown below.
Note: In a tree view, you can selectively collapse (or expand) a specific process tree by pressing either “+” or “-” key.

8. Change the Output Refresh Interval
To change the refresh interval of the htop output, use the -d command line option. “htop -d x”. Where x is referred in thenths of seconds.
htop -d 10
9. Htop Setup Menu – Press F2 or S
The following are the 4 high-level menu items available in htop setup.
- Meters – Change the behaviour of the meter bar in the header
- Display Options – Customize some of the htop display options
- Colors – Choose a color theme for the htop output
- Columns – This is extermly helpful when you are debugging a problem. Choose what column needs to be displayed for the processes in the htop output. This has more than 60 columns that you can choose from.

10. Strace a Process from htop – Press s
You can attach the selected process to strace by pressing s. This will display live update of the strace output displaying the system calls invoked by the selected process as shown below.
11. Display lsof Output inside htop – Press l
Select a process from the htop output and press l, which will display all the open files by the selected process. This uses lsof.

12. Scroll Process list Hoziontally and Vertically
Unlike top, in htop you can scroll the process list both horizontally and vertically. Select a process and press down arrow key which will scroll the list vertically and show you more processes in the list. You can also press “Page Up” or “Page Down” key to scoll the process list.
Select a process and press right arrow key which will scroll vertically to display the full command line of the process.
13. Follow a Process in htop Output – Press F
Select a process, and press F, which will follow the process. Since the htop output is sorted based on a column (by default %CPU), a process will keep changing its position in the list.
Following a process in the htop output is helpful when you are monitoring a particular process.
14. Kill Multiple Processes using Tag – Press Space and F9
You can group multiple processes by tagging them. Select a process, and press “Space bar”, which will tag the selected process. Once a process is tagged, the color of that line will change indicating that it is tagged. Scoll the list and tag multiple processes, and press F9, which will display the kill menu, from where you can kill all the tagged process.
Note: To untag a specific process, highlight that process, and press space bar again. To untag all processes press U.
15. Use Shortcut Character Keys (Instead of Function Keys)
The htop footer displays only the function keys to invoke the menu items. I find it easier to remember the character keys (instead of function keys). Also, if you are using putty connection manager (or some other ssh client), where the function keys are mapped to other functionalies, you need to use the following character keys to interact with htop.
| Shortcut Key | Function Key | Description |
|---|---|---|
| h | F1 | Invoke htop Help |
| S | F2 | Htop Setup Menu |
| / | F3 | Search for a Process |
| I | F4 | Invert Sort Order |
| t | F5 | Tree View |
| > | F6 | Sort by a column |
| [ | F7 | Nice – (change priority) |
| ] | F8 | Nice + (change priority) |
| k | F9 | Kill a Process |
| q | F10 | Quit htop |


Comments on this entry are closed.
Nice one, one tool for top+lsof+strace …
But, certainly, for command line tools and shell scripts and automation tools, this tool with ncurses will make things more clumsy. isn’t it?
awesome tool. loved it.
i love it too. it’s the only one swiss-knife tool for process controling.
Nice tutorial Ramesh. I’ve been using htop for quiet a few years now & regard it & its little friend mc as essential tools. I use Python | Plone | Zope as my CMS od choice & as I sometimes run 2 or more instances or ZEO’s at once, HTOP is about the only I can tell what the heck is going on :-))
Thanks….
As usual, nice tips!
Congratulations, Ramesh! =)
How can one change the colours in htop?
I would use it, but much of the information is unreadable becasue I use a light, rather than dark background.
B-Bye TOP
is there any way I can grep htop for a particular process. I want to check the cpu usage for a particular app.
Now I know top and htop, thanks to you Ramesh!
hi is there any possibility to get the “htop” screen short through mail one the %cpu increased above 95%….
Thanks adv…
Hi,
I need htop output in batch mode, it is like “top -b”, pls give me the command for htop.
I gave up on top a decade ago when I asked my teacher from the question “how can you display ALL processes?” and after searching for an hour, he concluded “you can’t”
Yes, you can’t. That is what top boils down to, it is ancient and obsolete. It is the Unix, while Htop is Linux, so out with the old and in with the new.
What is amazing that only one person felt they had to do something and build a better top. And I am so grateful that he did, thanks! I have been using htop more than any other tool over the years and especially the use of something as high tech (sarcastic) as COLORs has helped me so much. Yes, incredible enough, compared to some of the tools that have never been changed or improved since come over from Unix to Linux (with the smell of rot attached ;-), htop is a fresh breath of air.
Unfortunately, there are tons and tons of other tools that are hardly sufficient for the 21st century anymore, but nobody has improved them so far. Self satisfaction and old thinking seems to permeate a large block of the system admin community in Linux. Instead of getting a decidated command for a constantly repeating task, why not string it together half-baked with 3 pipes?
😉
So thanks you guys that are improving Linux and moving it to the 21st century. I wish somebody would redo curses, that is one hell of an ugly beast.
Checkout atop! atop is also worth a look. More advanced because it gets into the kernel itself.
Can you please anyone tell how htop will be useful in displaying windows , same like alternative window display of top.
Are field groups there in the case of htop?
You’re the man!!
Thank you.